

Meta Description: Dry bulk shipping stocks are among the most volatile in the market. Learn exactly what drives the swings — and how to invest in this sector with confidence.
The Direct Answer: Why Are Dry Bulk Shipping Stocks So Volatile?
Dry bulk shipping stocks are volatile because they sit at the intersection of everything that moves the global economy simultaneously: commodity demand, geopolitical disruptions, fleet supply cycles, currency shifts, fuel costs, and regulatory changes. A single development — a drought cutting grain exports, a mine opening in West Africa, a conflict rerouting ships away from a canal — can swing freight rates 30% in a week and move stock prices dramatically within hours.
Unlike most industries where revenues are relatively predictable, dry bulk shipping companies earn money primarily from daily charter rates — fees that fluctuate constantly based on real-time supply and demand for ship capacity. When those rates go up, profits can surge exponentially. When they fall, the same operating leverage works in reverse.
Understanding what drives those rates — and the stocks that depend on them — is the foundation of investing intelligently in this sector.
What Is Dry Bulk Shipping? (And Why It Matters to the Global Economy)
Before we talk about what moves these stocks, let’s establish what this industry actually does.
Dry bulk carriers transport unpackaged raw materials in large quantities across the world’s oceans. The primary cargoes are:
- Iron ore — the raw input for steel production, primarily flowing from Australia and Brazil to China
- Coal — both thermal (for power generation) and metallurgical (for steelmaking)
- Grain — wheat, corn, soybeans, moving from the Americas and Black Sea region to Asia and the Middle East
- Minor bulks — bauxite, fertilizers, cement, steel products, and other materials
These aren’t optional commodities. They are the physical inputs for buildings, bridges, power plants, and food supply chains. When the global economy grows, demand for these materials rises. When it contracts, demand falls. Dry bulk shipping stocks are, in this sense, one of the most direct proxies for global industrial activity available on any stock exchange.
That’s what makes them interesting — and that’s what makes them volatile.
The Baltic Dry Index: The Single Most Important Number for This Sector
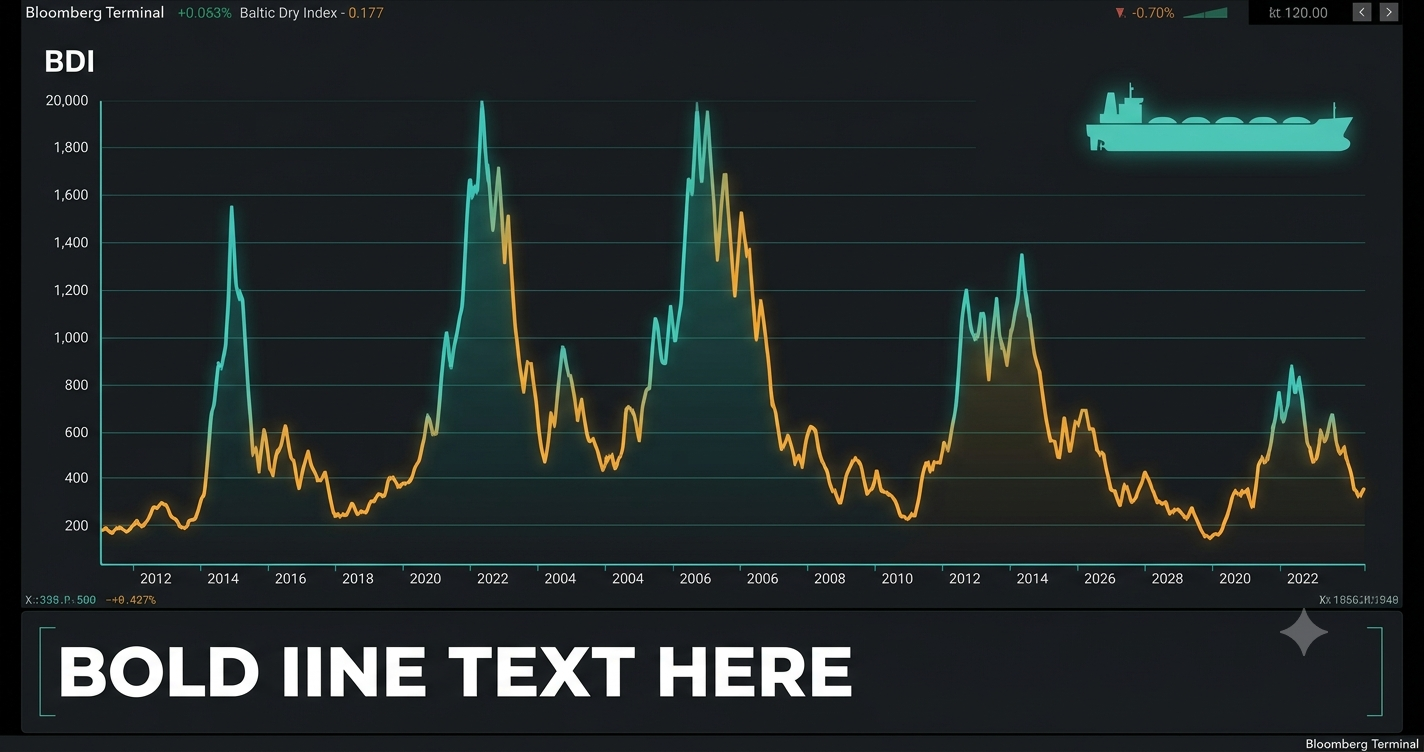
If you’re going to follow dry bulk shipping stocks, there is one data point you need to understand before any other: the Baltic Dry Index (BDI).
Published daily by the Baltic Exchange in London, the BDI is a composite index of freight rates across multiple vessel classes and shipping routes. It’s calculated based on actual daily freight booking assessments from a panel of international shipbrokers — making it a genuine, real-time market signal, not an estimate or model output.
BDI Historical Context
| Period | BDI Range | Conditions |
|---|---|---|
| All-time high | 11,793 (May 2008) | Pre-financial crisis commodity supercycle |
| All-time low | 290 (February 2016) | Severe fleet oversupply |
| 2021–2022 spike | 3,500–5,600 | Post-COVID demand surge + supply bottlenecks |
| 2023–2024 average | 1,200–1,800 | Normalization, Panama Canal drought |
| 2026 YTD range | 1,100–2,400 | Chinese steel demand volatile; Red Sea rerouting |
As a general rule: a BDI above 2,000 is profitable for most dry bulk operators. A BDI below 1,000 means many vessels are losing money on voyage costs. That gap between profitability and loss — spanning just 1,000 index points — explains the dramatic swings you see in shipping stock prices.
The Three Sub-Indices That Compose the BDI
The BDI is actually a weighted composite of three vessel-class indices. Each behaves differently:
1. Capesize Index (BCI) The largest vessels — 150,000+ deadweight tons — primarily carrying iron ore and coal on major transoceanic routes. Highly volatile: a single route change or cargo cancellation can swing the index 30% in a week. Represents approximately 40% of BDI weighting. Companies with heavy Capesize exposure (like Golden Ocean Group, GOGL) tend to be the most volatile dry bulk stocks on the market.
2. Panamax Index (BPI) Mid-size vessels (65,000–80,000 DWT) sized to fit through the original Panama Canal. Carry grain, coal, and fertilizers. More balanced between demand and supply drivers than Capesize — considered the most “liquid” segment of the dry bulk market.
3. Supramax / Handymax Index (BSI) Smaller, more versatile vessels (40,000–65,000 DWT) used across shorter routes and a wider variety of cargo types. Generally less volatile than Capesize because of diversified cargo exposure and geographic flexibility.
The 6 Core Drivers of Dry Bulk Shipping Volatility
This is where most investor guides stop at surface level. Let’s go deeper on each driver.
Driver 1: Chinese Industrial Demand
No single factor drives dry bulk shipping rates more than China. <cite index=”64-1″>China accounts for 54% of global steel production</cite>, and steel requires iron ore — the primary cargo of Capesize vessels. When Chinese steel mills are running hot, iron ore imports surge, Capesize rates spike, and shipping stocks follow. When Chinese steel production falls — due to a property market slowdown, government production caps, or weakening consumer demand — rates fall with it.
<cite index=”65-1″>As of early August 2026, the most significant downside risk flagged by analysts is weakening demand for iron ore in China, which threatens to disrupt the current market balance</cite> despite spot rates remaining at historically elevated levels.
This single-country dependency is the most important risk factor for investors to understand. When you buy a Capesize-heavy shipping company, you are making a significant indirect bet on Chinese industrial policy.
Driver 2: The Red Sea and Geopolitical Routing Disruptions
One of the most dramatic volatility amplifiers in recent years has been the rerouting of ships away from the Red Sea due to Houthi attacks on commercial vessels that began in late 2023. When ships avoid the Red Sea and Suez Canal, they instead navigate around the Cape of Good Hope — adding approximately 10–14 days to voyages between Asia and Europe.
Those extra sailing days are critical: they effectively remove ship capacity from the market (the same number of ships can make fewer round trips per year), tightening supply and pushing rates higher.
According to <cite index=”59-1″>BIMCO, a full return to the Red Sea could lower ship demand by 2%</cite> — a meaningful figure in a market where demand and supply are often balanced within a 1–3% margin. For now, <cite index=”60-1″>BIMCO’s forecasts assume ships will not return to the Red Sea in 2026 or 2027</cite>, keeping this supply-tightening effect in place.
The implication for investors: any credible news about Red Sea security — a ceasefire, a successful naval operation, a diplomatic agreement — can move dry bulk stocks materially within hours, because it changes the expected supply/demand equation without any actual change in cargo volumes.
Driver 3: Fleet Supply and the Orderbook Cycle
Shipping is a capital-intensive industry with a 3–5 year lag between ordering a new vessel and its delivery. This lag creates one of the most predictable — and most dangerous — patterns in the sector.
When freight rates are high, shipowners get optimistic. They order new vessels. Three years later, those vessels arrive — often right as the market is already softening. Suddenly, there’s too much ship capacity and too little cargo to fill it. Rates collapse. Stocks follow.
<cite index=”59-1″>The dry bulk fleet is forecast to grow 3% in 2026 and 3.5% in 2027, driven by higher panamax and supramax deliveries.</cite> Meanwhile, <cite index=”60-1″>demand growth of 1–2% in 2027 is expected to be outpaced by 3% fleet growth</cite> — a supply/demand imbalance that most serious analysts believe will weigh on freight rates and shipping stocks in 2027.
This is the single most important forward-looking risk in the sector today. If you’re considering a long-term position in dry bulk stocks, you need to understand the current orderbook: how many vessels are due for delivery, when, and in which segments.
Driver 4: The Simandou Mine — A Historic Shift in Iron Ore Geography
One of the most significant long-term structural developments in dry bulk shipping is the opening of the Simandou iron ore mine in Guinea, West Africa — one of the largest untapped iron ore deposits in the world.
<cite index=”62-1″>The first loading of Simandou ore took place in November 2025</cite>, marking a milestone that shipping analysts have watched for years. The mine is expected to ramp to approximately 60 million tonnes per year by 2028 and 120 million tonnes by 2029–2030.
Why does this matter for shipping stocks? Because Guinea is much farther from China than Australia or Brazil. Iron ore shipments from West Africa to East Asia require significantly longer voyages — creating substantially more tonne-miles of demand even if the volume in tonnes is similar.
<cite index=”68-1″>Analysts estimate Simandou’s ramp could add the equivalent of approximately 116 Capesize vessels of demand — roughly 10% to iron ore tonne-miles and 3.5% to total dry bulk tonne-miles</cite> by the time it reaches full capacity. This is one reason why some shipowners are willing to fix period charters at below-spot rates for 2027–2028: they’re betting the Simandou-driven tonne-mile boost will support rates even as the broader fleet expands.
Driver 5: Coal and Grain Trade Dynamics
While iron ore gets the most attention, coal and grain represent enormous portions of dry bulk trade — and they have their own volatility drivers.
Coal: <cite index=”64-1″>Coal shipments fell 3% between January and November 2025, compared to the same period the prior year, amid weaker steel production, greater renewable electricity generation in India and China, and higher domestic coal supply in China.</cite> BIMCO estimates coal shipments will continue to fall 3.5–4.5% between 2025 and 2027 as the energy transition accelerates — a structural headwind for Panamax vessels that carry significant coal volumes.
Grain: <cite index=”64-1″>Grain shipments also fell due to lower wheat shipments as trade out of the Black Sea weakened.</cite> However, the longer-term outlook is more constructive, with <cite index=”59-1″>minor bulk cargoes and grains expected to grow 6.5–7.5% between 2025 and 2027</cite>, partially offsetting coal’s decline.
The key insight: dry bulk isn’t one market. It’s several overlapping cargo markets that move independently — which is why diversified fleets (carrying multiple cargo types and sizes) tend to be less volatile investments than pure-play Capesize operators.
Driver 6: Bunker Fuel Costs and Decarbonization
Fuel — known in shipping as bunker fuel — is typically the largest single operating cost for a dry bulk vessel, often representing 40–60% of voyage expenses. When oil prices rise, shipping economics tighten significantly for vessel operators trading in the spot market.
The decarbonization overlay adds a new dimension to this cost structure. New IMO (International Maritime Organization) regulations are pushing the industry toward cleaner fuels: LNG dual-fuel vessels, methanol-ready ships, and eventually hydrogen or ammonia propulsion. Operators with older, less efficient fleets face increasing regulatory costs and competitive disadvantage against newer eco-vessels — creating a two-tier market where age and fuel efficiency directly affect earnings and valuations.
The Major Dry Bulk Shipping Stocks: Who They Are and How They Differ
For investors looking to gain exposure to this sector through individual equities, here are the primary publicly traded names:
| Company | Ticker | Vessel Focus | Notable Characteristic |
|---|---|---|---|
| Star Bulk Carriers | SBLK | All sizes (136 vessels) | Largest U.S.-listed dry bulk fleet; variable dividend formula |
| Golden Ocean Group | GOGL | Capesize-heavy | Highest rate sensitivity; strong when BDI > 2,500 |
| Safe Bulkers | SB | Panamax/Kamsarmax | Lower volatility; variable dividend tied to cash flow |
| Genco Shipping | GNK | Ultramax/Supramax | U.S.-focused management; value-oriented strategy |
| Diana Shipping | DSX | Panamax/Capesize | Greek operator; monitor fleet age carefully |
| Seanergy Maritime | SHIP | Capesize pure-play | Small-cap; highest BDI sensitivity of major listings |
| C3is Inc. | CISS | Handysize + Aframax | Micro-cap; expanding into tankers; spin-off from Imperial Petroleum |
Each of these companies has a different risk profile depending on its fleet composition, contract structure (spot vs. time charter), leverage ratio, and management track record. A Capesize-heavy operator like Golden Ocean will move far more dramatically on BDI swings than a diversified operator like Star Bulk.
The Variable Dividend Reality
One feature that attracts many investors to dry bulk stocks is the potential for high dividend yields during strong rate environments. Star Bulk Carriers, for example, uses a variable dividend formula — distributions are calculated based on total quarterly cash balance after debt servicing and capital expenditure.
<cite index=”69-1″>Depending on the BDI cycle, SBLK’s trailing dividend yield has often exceeded 5–10%</cite> — an extraordinary figure compared to most industrial equities.
But here’s what income-focused investors must understand: these dividends are not fixed. They rise dramatically when rates are high and can be cut to zero when rates fall. A variable dividend in shipping is fundamentally different from the stable quarterly payout of a utility or consumer staples company. Investing in shipping stocks for income requires accepting that income stream will fluctuate with freight rates.
The 2026 Supply/Demand Picture: What the Data Says Now
As of August 2026, the dry bulk market presents a nuanced picture that resists simple characterization.
<cite index=”65-1″>The dry bulk market continues to trade at historically elevated levels with no immediate signs of a correction, while freight rate volatility has collapsed to multi-year lows.</cite> Current spot rate strength is primarily sustained by structural vessel supply constraints — driven by ongoing geopolitical disruptions and an intensive global drydocking schedule.
On the supply side: <cite index=”59-1″>BIMCO expects dry bulk demand to grow 2–3% in 2026 while supply is projected to grow 2.5%</cite> — a near-balanced equation that the organization expects will keep freight rates supported through the year.
On the demand side: <cite index=”63-1″>the second half of 2025 saw some stabilization thanks to eased trade policies between the U.S. and China, including a tariff truce in early November 2025</cite>, which helped steady commodity flows heading into 2026.
The longer-term concern: <cite index=”60-1″>demand growth of 1–2% in 2027 is expected to be outpaced by fleet growth of approximately 3%</cite>, suggesting the supply/demand balance will weaken meaningfully in 2027. Investors with a 12–18 month time horizon need to weigh this dynamic carefully.
How to Think About Investing in Dry Bulk Stocks: A Framework
From studying this sector closely, a few principles consistently separate investors who do well from those who don’t:
Principle 1: Trade the Cycle, Not the Company
In most industries, company quality matters most. In dry bulk shipping, rate cycle positioning often matters more. A mediocre company in a rising rate environment will typically outperform an excellent company in a falling rate environment. Before evaluating any individual stock, form a view on where you are in the BDI cycle.
Principle 2: Understand the Contract Mix
Two companies with identical fleets can have very different risk profiles depending on how much of their capacity is contracted on:
- Spot voyages: Full exposure to daily rate volatility — maximum upside and downside
- Time charters: Fixed daily rate for a set period — predictable revenue, but you miss upside if rates spike
During low-rate environments, companies with more time charters have protection. During high-rate environments, spot operators capture more of the upside. Know your company’s contract mix before you invest.
Principle 3: Watch the Orderbook, Not Just Current Rates
Current rates tell you where you are. The orderbook tells you where you’re going. If a significant number of new vessels are scheduled for delivery in the next 18–24 months, that’s a forward-looking supply increase that current rates don’t yet reflect.
Principle 4: Don’t Confuse High Dividends With Safety
<cite index=”69-1″>A sudden downturn in global trade can lead to a significant reduction or temporary suspension of the dividend</cite> at even the largest, most established dry bulk operators. Variable dividends in this sector are a feature of the business model, not a promise.
Principle 5: Size Your Position for the Volatility
Dry bulk stocks regularly move 15–25% in a single month during rate swings. That’s not abnormal — it’s structural. Position sizing accordingly is not pessimism. It’s risk management.
Pros and Cons: Investing in Dry Bulk Shipping Stocks
| ✅ Advantages | ❌ Disadvantages |
|---|---|
| Direct exposure to global economic growth | Extreme rate volatility creates dramatic price swings |
| Potential for very high dividend yields | Variable dividends can be cut to zero rapidly |
| Tangible assets (vessels) with residual value | Exposure to single-country risk (China) |
| Multiple ways to play (Capesize vs. diversified) | Fleet oversupply cycles can last years |
| Geopolitical disruptions can be tailwinds | Decarbonization costs rising for older fleets |
| Simandou tonne-mile boost on the horizon | Red Sea normalization would reduce demand by ~2% |
| Historically low correlation to S&P 500 | Requires active monitoring of BDI and orderbook |
Before vs. After: What Changes When You Understand This Sector
| Before Understanding Dry Bulk | After Understanding Dry Bulk |
|---|---|
| Buying on high dividend yield alone | Assessing whether the rate cycle supports that yield |
| Panicking when stock drops 20% | Checking BDI movement to understand the cause |
| Treating all shipping stocks as equivalent | Distinguishing Capesize vs. Supramax risk profiles |
| Ignoring the orderbook | Tracking 18–24 month vessel delivery schedules |
| Missing geopolitical routing impacts | Monitoring Red Sea, Panama Canal, Strait of Hormuz |
| Surprised by dividend cuts | Expecting dividend variability and sizing positions accordingly |
FAQ: Dry Bulk Shipping Stocks — Your Questions Answered
Q1: What is the Baltic Dry Index and why does it matter to shipping stocks?
The Baltic Dry Index (BDI) is a daily benchmark published by the Baltic Exchange that tracks freight rates for dry bulk vessels across multiple routes and ship sizes. It’s the single most important indicator for dry bulk shipping stocks because it directly reflects the revenue environment for ship operators. When the BDI rises, shipping company profits typically improve dramatically due to operating leverage. When it falls, profits can evaporate quickly. Most serious dry bulk investors check the BDI daily.
Q2: What are the biggest risks in dry bulk shipping stocks?
The five primary risks are: (1) Chinese industrial demand slowdown reducing iron ore and coal shipments; (2) fleet oversupply from too many new vessel deliveries; (3) geopolitical normalization (Red Sea reopening) shortening sailing distances; (4) dividend cuts when freight rates fall; and (5) decarbonization costs for older, less fuel-efficient fleets. Understanding which of these risks is most relevant at any given point in the cycle is the core analytical challenge of investing in this sector.
Q3: How does China affect dry bulk shipping rates?
China accounts for approximately 54% of global steel production and is the world’s largest importer of iron ore and coal — the two largest dry bulk cargo categories. Changes in Chinese steel output, government infrastructure stimulus, property market activity, and domestic coal production all directly affect demand for dry bulk shipping capacity. This makes Chinese economic policy the single most important external variable for dry bulk freight rates and, by extension, shipping stock valuations.
Q4: What is the difference between a Capesize and Panamax vessel?
Capesize vessels (150,000+ DWT) are the largest bulk carriers, primarily carrying iron ore and coal on major transoceanic routes. They’re too large to fit through the Panama Canal and must sail around Cape Horn or the Cape of Good Hope. Panamax vessels (65,000–80,000 DWT) were originally sized to fit through the original Panama Canal and carry grain, coal, and fertilizers across a more diversified route network. Capesize stocks are significantly more volatile than Panamax stocks due to higher rate sensitivity and more concentrated cargo exposure.
Q5: Are dry bulk shipping stocks good for income investors?
They can be — but with important caveats. Companies like Star Bulk (SBLK) and Safe Bulkers (SB) use variable dividend formulas tied to cash flow, which can produce yields of 5–10%+ during strong rate environments. However, those same dividends can be reduced or eliminated when rates fall. Dry bulk shipping dividends are fundamentally different from stable utility or REIT dividends — they are cyclical income, not fixed income.
Q6: What is the Simandou mine and why does it matter for shipping?
Simandou is a massive iron ore mine in Guinea, West Africa, that began its first ore loadings in late 2025. Because Guinea is much farther from China than the traditional iron ore exporters (Australia and Brazil), shipping iron ore from Simandou to China requires significantly longer voyages. This increases “tonne-miles” — the combined measure of cargo volume and distance — which boosts demand for Capesize vessels even without increasing the tonnes of ore shipped. Analysts estimate Simandou’s full ramp could add the equivalent of ~116 Capesize vessels of demand by 2029–2030.
Q7: What is the 2026 supply/demand outlook for dry bulk shipping?
According to BIMCO, demand is forecast to grow 2–3% in 2026 while supply grows approximately 2.5% — a near-balanced equation expected to keep freight rates supported through year-end. The bigger concern is 2027, when fleet growth is projected to outpace demand growth, potentially weakening rates. The Red Sea situation and Chinese iron ore demand trajectory are the two biggest wildcards that could shift this outlook in either direction.
Q8: How do I start researching dry bulk shipping stocks?
Begin with three data points: (1) the current Baltic Dry Index level and its 12-month trend (available free at tradingeconomics.com); (2) the vessel orderbook — how many new ships are scheduled for delivery in the next 24 months (available from BIMCO reports); and (3) the specific fleet composition of any company you’re considering — what percentage is Capesize vs. smaller, and what percentage is on spot vs. time charter. From there, read the most recent earnings call transcripts for the company’s management view on rates.
Conclusion: Volatility Is the Feature, Not the Bug
Investors who approach dry bulk shipping stocks looking for stability are looking in the wrong place. This sector is structurally volatile — by design, by nature, and by the basic economics of a commodity-linked, operationally leveraged, globally exposed industry.
But volatility is not the same as risk for an investor who understands what they own.
The investors who have done well in dry bulk over market cycles are the ones who understood the BDI cycle well enough to have conviction when stocks fell 30% on temporary rate weakness. They knew that a Red Sea rerouting was tightening effective supply. They tracked the orderbook well enough to know when fleet overcapacity was coming. They understood that a high variable dividend in a strong rate environment would become a low (or zero) dividend in a weak one — and sized their positions accordingly.
The sector rewards research and penalizes assumptions. If you’re willing to do the work — to track the BDI, understand the cargo mix, monitor the orderbook, and follow the geopolitical developments that reshape trade routes — dry bulk shipping stocks offer a genuinely differentiated investment opportunity that behaves unlike almost anything else in a diversified portfolio.
Start with the BDI. Read it every morning for 30 days. Watch how it moves and what drives it. That discipline alone will put you ahead of the vast majority of retail investors who own shipping stocks without understanding why they move.
📩 Want weekly dry bulk market updates — BDI movements, fleet data, and institutional activity in shipping stocks? Subscribe to our newsletter for the analysis that serious shipping investors rely on.
💬 Which dry bulk shipping stock are you watching right now? Drop a comment below and tell us what’s driving your thesis — we read every one.
📤 Know an investor who’s been puzzled by shipping stock volatility? Share this guide. Understanding why these stocks move is the first step to investing in them intelligently.
Suggested Author Bio
[Author Name] is a maritime industry analyst and equity researcher with over a decade of experience covering global shipping markets, commodity trade flows, and the publicly listed vessel operators that connect them. They track the Baltic Dry Index and dry bulk market fundamentals daily and have written extensively on the intersection of macroeconomic trends and shipping sector valuations. Follow them on [LinkedIn/Twitter] for regular dry bulk market commentary.
Disclaimer: This article is for educational and informational purposes only and does not constitute financial or investment advice. Dry bulk shipping stocks carry significant risk, including loss of principal. Always conduct your own due diligence and consult a licensed financial advisor before making investment decisions. Market data and forecasts cited reflect information available as of August 2026.

