
Welcome to Articlgiants.com. Today, our topic of discussion is how inflation affected the average consumer and all products in February.
According to CNBC News, all products and consumer prices increased by 0.2% in February. Which is generally beyond everyone’s expectations. If we look at it on a general annual basis, we see that where inflation was 2.8% and core was 3.1%. Which was 0.1% lower than the level compared to the previous month.
According to the Bureau of Labor Statistics on Wednesday, the price of goods and services in February increased much less than expected. Which has brought relief to consumers and businesses. There are fears that the impact of tariffs on inflation may be.
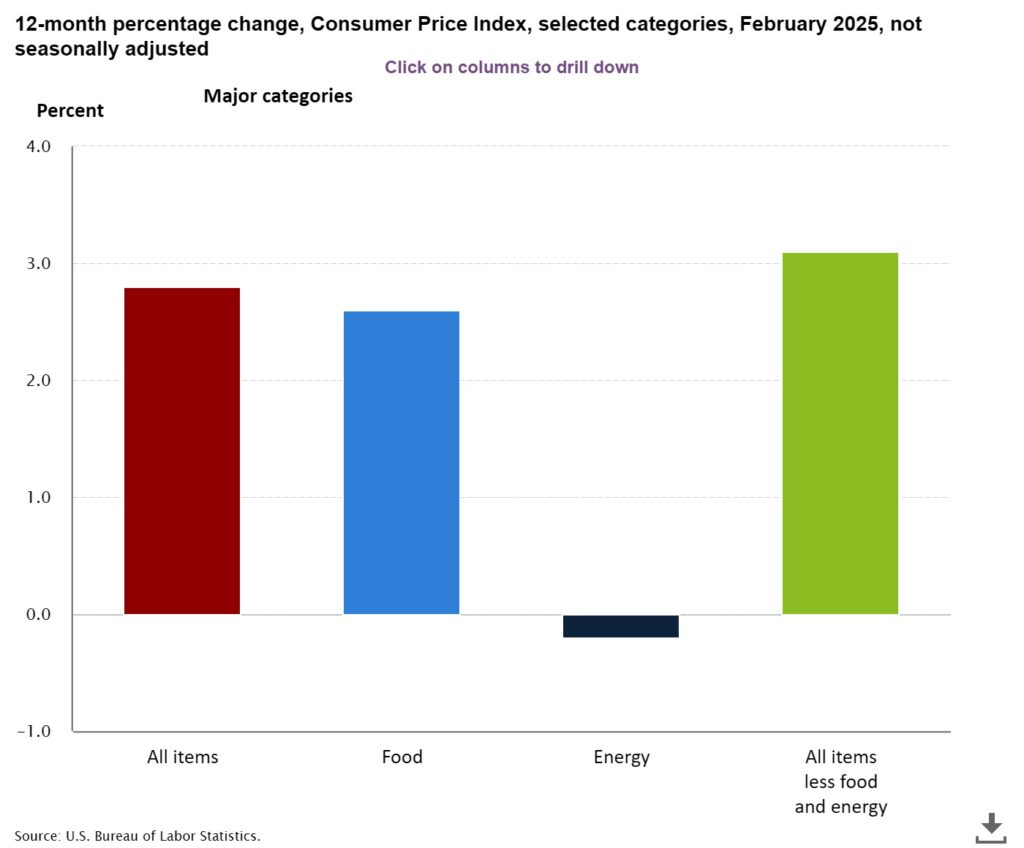
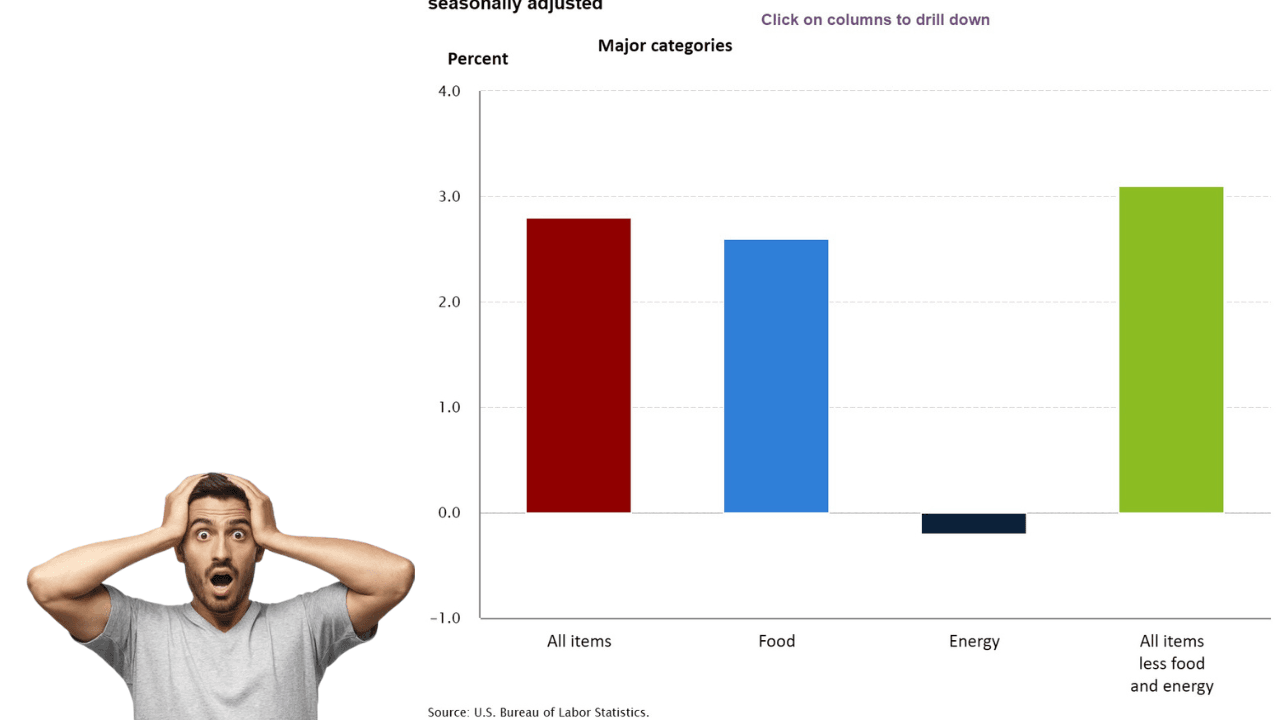
According to the US Department of Labor, the Consumer Price Index, a broad measure of spending across the US economy, rose 0.2%, bringing the overall inflation rate to 2.8%. However, the CPI for all items rose 0.5% in January.
Excluding food and energy prices, the core CPI rose 0.2% in the month. And on a 12-month basis, it was 3.1%. The core CPI rose 0.4% in January.
Read More
Sunil Chhetri: The Unyielding Force Behind India’s Football Renaissance
According to the Dow Jones survey, participants in both the headline and core indices were expecting a 0.3% increase.
The annual rates were 2.9% and 3.2%, respectively, which means that the overall rate was 0.1% lower than expected.
Table A.Percent changes in CPI for All Urban Consumers (CPI-U): U.S. city average
| Seasonally adjusted changes from preceding month | Un- adjusted 12-mos. ended Feb. 2025 | |||||||
|---|---|---|---|---|---|---|---|---|
| Aug. 2024 | Sep. 2024 | Oct. 2024 | Nov. 2024 | Dec. 2024 | Jan. 2025 | Feb. 2025 | ||
| All items | 0.2 | 0.2 | 0.2 | 0.3 | 0.4 | 0.5 | 0.2 | 2.8 |
| Food | 0.2 | 0.3 | 0.2 | 0.3 | 0.3 | 0.4 | 0.2 | 2.6 |
| Food at home | 0.1 | 0.3 | 0.2 | 0.4 | 0.3 | 0.5 | 0.0 | 1.9 |
| Food away from home(1) | 0.3 | 0.3 | 0.2 | 0.3 | 0.3 | 0.2 | 0.4 | 3.7 |
| Energy | -1.0 | -1.0 | -0.2 | 0.1 | 2.4 | 1.1 | 0.2 | -0.2 |
| Energy commodities | -1.3 | -2.3 | -1.1 | 0.2 | 3.9 | 1.9 | -0.9 | -3.2 |
| Gasoline (all types) | -1.2 | -2.3 | -1.0 | 0.3 | 4.0 | 1.8 | -1.0 | -3.1 |
| Fuel oil | -2.8 | -3.8 | -2.3 | -1.4 | 2.1 | 6.2 | 0.8 | -5.1 |
| Energy services | -0.7 | 0.6 | 0.7 | -0.1 | 0.8 | 0.3 | 1.4 | 3.3 |
| Electricity | -0.4 | 0.5 | 0.8 | -0.2 | 0.2 | 0.0 | 1.0 | 2.5 |
| Utility (piped) gas service | -1.6 | 0.7 | 0.5 | 0.5 | 2.8 | 1.8 | 2.5 | 6.0 |
| All items less food and energy | 0.3 | 0.3 | 0.3 | 0.3 | 0.2 | 0.4 | 0.2 | 3.1 |
| Commodities less food and energy commodities | -0.1 | 0.2 | 0.0 | 0.2 | 0.0 | 0.3 | 0.2 | -0.1 |
| New vehicles | 0.0 | 0.1 | 0.0 | 0.5 | 0.4 | 0.0 | -0.1 | -0.3 |
| Used cars and trucks | -0.2 | 0.5 | 1.2 | 1.3 | 0.8 | 2.2 | 0.9 | 0.8 |
| Apparel | 0.1 | 1.0 | -0.9 | 0.1 | 0.1 | -1.4 | 0.6 | 0.6 |
| Medical care commodities(1) | -0.2 | -0.7 | -0.2 | -0.1 | 0.0 | 1.2 | 0.1 | 2.3 |
| Services less energy services | 0.4 | 0.4 | 0.3 | 0.3 | 0.3 | 0.5 | 0.3 | 4.1 |
| Shelter | 0.5 | 0.3 | 0.4 | 0.3 | 0.3 | 0.4 | 0.3 | 4.2 |
| Transportation services | 0.8 | 1.2 | 0.4 | 0.1 | 0.5 | 1.8 | -0.8 | 6.0 |
| Medical care services | -0.1 | 0.6 | 0.3 | 0.3 | 0.2 | 0.0 | 0.3 | 3.0 |
| Footnotes | ||||||||
