

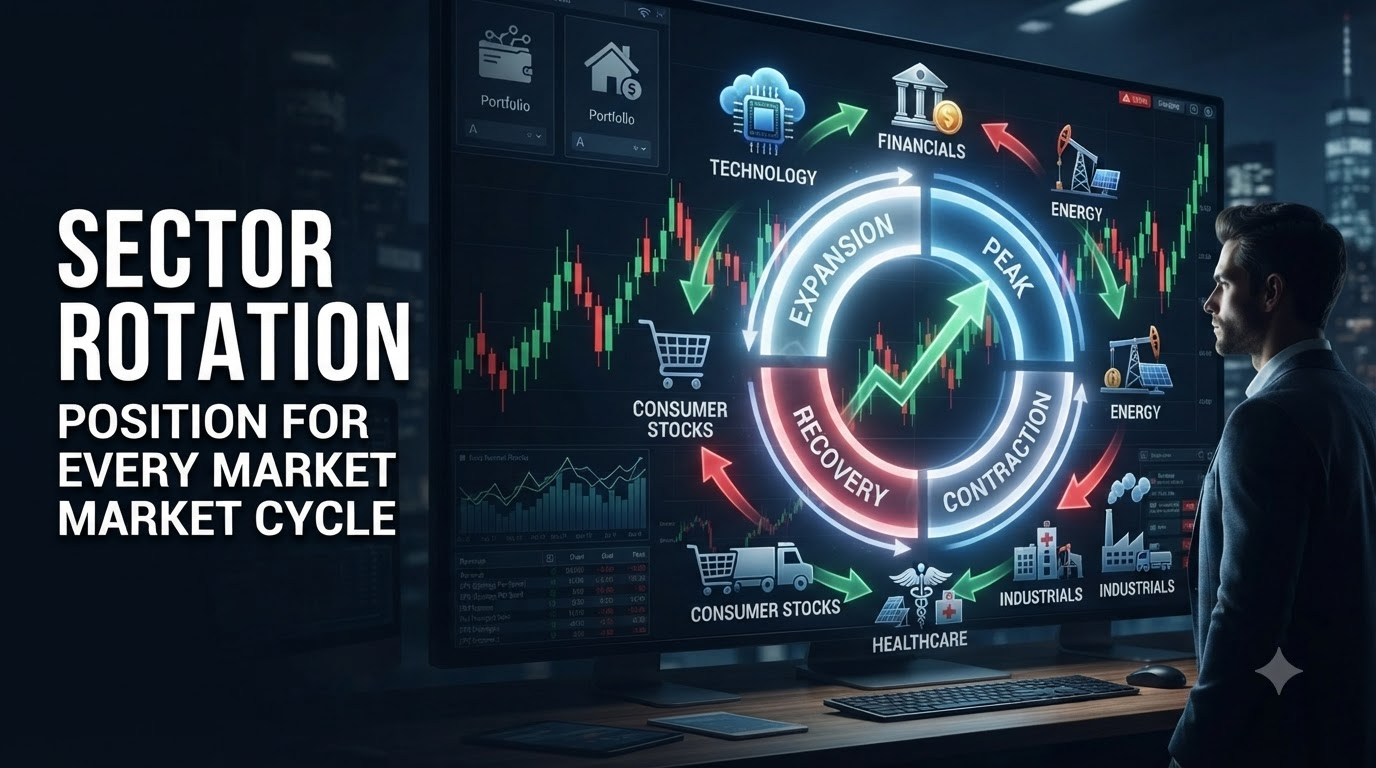
Meta Description: Learn how sector rotation strategy works, which sectors lead in each economic cycle, and how to reposition your portfolio to stay ahead of the market.
Introduction: The Market Always Telegraphs Its Next Move — If You Know Where to Look
Most investors ask the wrong question during market transitions.
They ask: “Should I be in the market right now?”
The smarter question — the one professional fund managers and institutional investors ask — is: “Which part of the market should I be in right now?”
That distinction is the entire foundation of sector rotation strategy. And it’s one of the most powerful, time-tested frameworks in all of investing.
Here’s the insight at the core of it: the stock market is not one monolithic thing that goes up or down. It’s a collection of 11 distinct sectors — technology, healthcare, energy, financials, consumer staples, and more — each with its own economic drivers, sensitivity to interest rates, and performance patterns across different phases of the economic cycle.
Some sectors thrive when the economy is accelerating. Others hold up when it’s contracting. Some lead at the beginning of a recovery. Others peak before the broader market tops out.
If you understand these patterns — and position your portfolio accordingly — you don’t have to perfectly time the market. You just have to understand where we are in the cycle and which sectors historically perform best from here.
This guide gives you the full framework: what sector rotation is, how the economic cycle drives it, which sectors to watch in each phase, and how to implement this strategy practically — whether you’re a passive investor or an active one.
Let’s get into it.
What Is Sector Rotation Strategy?
Sector rotation is an active investment strategy that involves shifting portfolio allocations between different industry sectors based on the current or anticipated phase of the economic cycle.
The underlying principle is straightforward: different sectors of the economy perform differently depending on economic conditions. By moving money into sectors that are positioned to outperform — and reducing exposure to those likely to underperform — investors aim to generate better risk-adjusted returns than a static, buy-and-hold allocation.
This isn’t day trading. It isn’t market timing in the traditional sense. It’s a macro-driven, fundamentally grounded approach to portfolio positioning that works on a timeframe of months to years, not days or weeks.
Sector rotation is practiced by:
- Large institutional investors (pension funds, endowments, mutual funds)
- Hedge funds managing multi-billion dollar portfolios
- Sophisticated retail investors building long-term wealth
- ETF strategists constructing tactical allocation models
Key Insight: According to Fidelity’s sector investing research, sector selection can account for a significant portion of portfolio return differences — often more than individual stock selection within sectors.
The Economic Cycle: The Engine Behind Sector Rotation
To understand sector rotation, you first need to understand the economic cycle — the recurring pattern of expansion, peak, contraction, and recovery that economies move through over time.
The economic cycle has four distinct phases, and each one creates a different environment for different business types:
Phase 1: Early Cycle (Recovery)
What’s happening economically:
- Economy emerging from recession
- Interest rates are low or falling
- Credit conditions loosening
- Consumer and business confidence beginning to recover
- Corporate earnings starting to stabilize after declines
Characteristics:
- GDP growth accelerating from a low base
- Unemployment still elevated but beginning to decline
- Housing activity picking up
- Consumer spending recovering in discretionary categories
Historically strong sectors:
- ✅ Consumer Discretionary
- ✅ Financials
- ✅ Real Estate
- ✅ Industrials
- ✅ Materials
Why: Low rates benefit rate-sensitive sectors like financials and real estate. Consumer discretionary picks up as confidence returns. Industrials and materials benefit from early signs of economic rebuilding.
Phase 2: Mid Cycle (Expansion)
What’s happening economically:
- Economy in full expansion mode
- GDP growth strong and broad-based
- Employment rising, wages growing
- Corporate profits expanding
- Credit readily available, business investment increasing
Characteristics:
- Longest phase of the typical economic cycle
- Earnings growth broad across sectors
- Consumer spending robust
- Business capital expenditure elevated
Historically strong sectors:
- ✅ Technology
- ✅ Communication Services
- ✅ Industrials
- ✅ Materials
- ✅ Energy (if commodity prices rising)
Why: Technology and communication services benefit from strong corporate and consumer spending. Industrial production peaks during expansion. Technology investment accelerates as businesses upgrade systems and infrastructure.
Phase 3: Late Cycle (Slowdown)
What’s happening economically:
- Growth still positive but decelerating
- Inflation rising as economy runs hot
- Federal Reserve raising interest rates to cool inflation
- Credit conditions tightening
- Corporate margins beginning to compress
Characteristics:
- Labor market very tight — wage inflation accelerating
- Commodity prices often elevated
- Consumer starting to feel squeeze of higher prices
- Business investment beginning to moderate
Historically strong sectors:
- ✅ Energy
- ✅ Materials
- ✅ Healthcare
- ✅ Consumer Staples
- ✅ Utilities (beginning to attract defensive interest)
Why: Energy and materials benefit from elevated commodity prices and inflation. Healthcare and consumer staples are defensive — people need these regardless of economic conditions. As rate hike fears grow, investors begin rotating toward stability.
Phase 4: Recession (Contraction)
What’s happening economically:
- GDP contracting for two or more consecutive quarters
- Unemployment rising
- Consumer and business confidence falling
- Corporate earnings declining broadly
- Federal Reserve beginning to cut rates to stimulate recovery
Characteristics:
- Risk aversion dominates investor sentiment
- Capital preservation prioritized over growth
- Dividend-paying, cash-generating companies outperform
- Cyclical sectors hit hardest
Historically strong sectors:
- ✅ Consumer Staples
- ✅ Healthcare
- ✅ Utilities
- ✅ Telecommunications
Why: These are the classic defensive sectors — companies providing essential goods and services that people need regardless of economic conditions. Their earnings hold up better during downturns, they typically pay reliable dividends, and their stocks decline less than the broader market.
The Complete Sector Rotation Map
Here’s the full rotation framework in one visual reference:
| Economic Phase | Leading Sectors | Lagging Sectors | Key Driver |
|---|---|---|---|
| Early Cycle (Recovery) | Consumer Discretionary, Financials, Real Estate, Industrials | Utilities, Consumer Staples | Low rates, recovering confidence |
| Mid Cycle (Expansion) | Technology, Communication Services, Industrials, Materials | Real Estate, Utilities | Strong growth, rising earnings |
| Late Cycle (Slowdown) | Energy, Materials, Healthcare, Consumer Staples | Technology, Consumer Discretionary | Inflation, tightening credit |
| Recession (Contraction) | Consumer Staples, Healthcare, Utilities, Telecom | Financials, Industrials, Energy | Defensive positioning, rate cuts beginning |
The 11 S&P 500 Sectors: A Complete Guide
The S&P 500 is divided into 11 official sectors under the Global Industry Classification Standard (GICS), developed by MSCI and S&P Global. Here’s what you need to know about each:
1. Technology (XLK)
What it includes: Software companies, hardware manufacturers, semiconductor designers, IT services, and tech consulting firms. Major constituents include Apple, Microsoft, Nvidia, and Broadcom.
Economic sensitivity: HIGH — particularly sensitive to interest rates (growth valuations compress when rates rise) and corporate spending cycles.
Best cycle phase: Mid-cycle expansion Dividend profile: Low — most tech companies reinvest cash into growth Key risk: Rate sensitivity; regulatory pressure; valuation multiple compression
2. Healthcare (XLV)
What it includes: Pharmaceutical companies, biotech firms, medical device makers, health insurance companies, and hospital systems. Major constituents include UnitedHealth, Johnson & Johnson, Eli Lilly, and Abbott.
Economic sensitivity: LOW — healthcare demand is largely non-cyclical. People need medication and medical care in recessions too.
Best cycle phase: Late cycle and recession Dividend profile: Moderate — large pharma companies pay reliable dividends Key risk: FDA regulatory decisions, drug pricing legislation, patent cliffs
3. Financials (XLF)
What it includes: Banks (regional and money-center), insurance companies, asset managers, brokerage firms, and payment processors. Major constituents include JPMorgan Chase, Berkshire Hathaway, Visa, and Bank of America.
Economic sensitivity: HIGH — deeply tied to interest rate environment and credit cycle.
Best cycle phase: Early cycle recovery (when rates are rising from lows) Dividend profile: Moderate to high — major banks pay significant dividends Key risk: Credit quality deterioration, regulatory capital requirements, interest rate spread compression
4. Consumer Discretionary (XLY)
What it includes: Retailers, automakers, hotels, restaurants, luxury goods, and e-commerce companies. Major constituents include Amazon, Tesla, McDonald’s, and Nike.
Economic sensitivity: VERY HIGH — consumer spending on non-essentials rises and falls sharply with economic confidence and employment.
Best cycle phase: Early to mid-cycle recovery Dividend profile: Low to moderate Key risk: Consumer confidence deterioration, inflation squeezing disposable income, interest rates affecting big-ticket purchases
5. Consumer Staples (XLP)
What it includes: Food and beverage companies, household product makers, tobacco companies, and grocery retailers. Major constituents include Procter & Gamble, Coca-Cola, PepsiCo, and Costco.
Economic sensitivity: VERY LOW — the classic defensive sector. People buy toothpaste, food, and cleaning products regardless of economic conditions.
Best cycle phase: Late cycle and recession Dividend profile: HIGH — some of the most reliable dividend payers in the market Key risk: Input cost inflation squeezing margins, private label competition, low revenue growth ceiling
6. Energy (XLE)
What it includes: Oil and gas exploration and production companies, refiners, pipeline operators, and energy services firms. Major constituents include ExxonMobil, Chevron, ConocoPhillips, and EOG Resources.
Economic sensitivity: MODERATE — tied more to commodity prices than pure economic cycle, though demand does follow economic activity.
Best cycle phase: Late cycle (when inflation and commodity prices are elevated) Dividend profile: HIGH — energy majors are known for large dividends and buybacks Key risk: Oil price volatility, energy transition regulatory risk, geopolitical supply disruptions
7. Industrials (XLI)
What it includes: Aerospace and defense companies, transportation firms, machinery manufacturers, construction companies, and staffing firms. Major constituents include Caterpillar, Honeywell, Boeing, and Union Pacific.
Economic sensitivity: HIGH — closely tied to business investment, infrastructure spending, and global trade volumes.
Best cycle phase: Early to mid-cycle Dividend profile: Moderate Key risk: Global trade disruption, supply chain constraints, defense budget changes
8. Materials (XLB)
What it includes: Mining companies, chemical producers, packaging companies, and construction materials firms. Major constituents include Linde, Sherwin-Williams, Freeport-McMoRan, and Air Products.
Economic sensitivity: HIGH — commodity prices and industrial demand drive this sector.
Best cycle phase: Mid to late cycle (when commodity demand is strong) Dividend profile: Moderate Key risk: Commodity price cycles, China demand (major consumer of raw materials), environmental regulation
9. Utilities (XLU)
What it includes: Electric utilities, gas utilities, water companies, and renewable energy utilities. Major constituents include NextEra Energy, Duke Energy, Southern Company, and American Electric Power.
Economic sensitivity: VERY LOW — utility revenues are regulated and stable regardless of economic conditions.
Best cycle phase: Recession and early recovery (also benefits during rate-cutting cycles) Dividend profile: VERY HIGH — utilities are primary income investments known for large, stable dividends Key risk: Rising interest rates (utilities are rate-sensitive due to high debt loads and dividend competition with bonds), regulatory risk
10. Real Estate / REITs (XLRE)
What it includes: Real estate investment trusts (REITs) across commercial, residential, industrial, data center, and healthcare real estate. Major constituents include Prologis, American Tower, Equinix, and Public Storage.
Economic sensitivity: MODERATE — sensitive to interest rates (borrowing costs) and economic demand for space.
Best cycle phase: Early cycle (low rate environment) Dividend profile: VERY HIGH — REITs are required by law to distribute at least 90% of taxable income as dividends Key risk: Rising interest rates (increases borrowing costs and makes dividend yields less competitive), vacancy rates, property value declines
11. Communication Services (XLC)
What it includes: Telecom companies, media and entertainment companies, social media platforms, and streaming services. Major constituents include Meta, Alphabet (Google), Netflix, and AT&T.
Economic sensitivity: MODERATE — mix of defensive (telecom) and growth (digital media/advertising) characteristics.
Best cycle phase: Mid-cycle expansion (for digital advertising exposure) Dividend profile: Mixed — telecom pays high dividends; tech-oriented names pay none Key risk: Advertising cycle sensitivity, regulatory antitrust concerns, cord-cutting trends
How Institutional Investors Actually Execute Sector Rotation
Understanding the theory is one thing. Seeing how professionals implement it is another. Here’s how sophisticated investors actually execute sector rotation:
The Top-Down Research Process
Step 1 — Identify the economic cycle phase Institutional investors analyze a combination of leading economic indicators — the Conference Board Leading Economic Index, yield curve shape, PMI data, credit spreads, and Federal Reserve communications — to assess where the economy currently sits in the cycle and where it’s likely heading.
Step 2 — Map sector implications Based on the cycle assessment, they identify which sectors are historically positioned to outperform and which are likely to underperform over the next 6–18 months.
Step 3 — Evaluate relative strength Even within expected sector leaders, they look for relative strength — which sectors are already showing momentum and outperformance versus the broader market? Relative strength charts comparing sector ETFs to the S&P 500 are a key tool here.
Step 4 — Size positions and manage transitions They don’t flip entirely out of one sector and into another overnight. They gradually increase overweight positions in favored sectors and reduce (but rarely eliminate) underweight positions — managing transaction costs and tax implications.
Step 5 — Monitor and reassess continuously Economic conditions evolve. The cycle doesn’t always follow the textbook. Professional investors continuously reassess their cycle thesis against incoming data, adjusting positions as evidence accumulates.
Practical Sector Rotation for Individual Investors
You don’t need a Bloomberg Terminal or a research team to implement a version of sector rotation in your own portfolio. Here’s a practical framework:
Option 1: Sector ETF Rotation (Most Accessible)
The simplest implementation uses sector ETFs — exchange-traded funds that track individual S&P 500 sectors. The most widely used are the SPDR Sector ETFs from State Street Global Advisors:
| Sector | ETF Ticker | Expense Ratio |
|---|---|---|
| Technology | XLK | 0.10% |
| Healthcare | XLV | 0.10% |
| Financials | XLF | 0.10% |
| Consumer Discretionary | XLY | 0.10% |
| Consumer Staples | XLP | 0.10% |
| Energy | XLE | 0.10% |
| Industrials | XLI | 0.10% |
| Materials | XLB | 0.10% |
| Utilities | XLU | 0.10% |
| Real Estate | XLRE | 0.10% |
| Communication Services | XLC | 0.10% |
With sector ETFs, you can overweight favored sectors and underweight laggard sectors while maintaining broad diversification within each sector.
Option 2: Tactical Overlay on Core Portfolio
Rather than replacing your entire portfolio with a sector rotation strategy, many investors use it as a tactical overlay on a core passive holding:
- Core (70–80%): Broad market index fund (e.g., VOO, SPY, or VTI)
- Tactical (20–30%): Sector ETFs tilted toward cycle-favored sectors
This approach captures the benefits of sector rotation without abandoning the diversification benefits of a core index position.
Option 3: Stock Selection Within Favored Sectors
If you prefer individual stock picking, sector rotation provides a useful top-down filter. Rather than screening the entire universe of stocks, you focus your research within sectors that are historically positioned to outperform in the current cycle phase — improving your odds before you even begin fundamental analysis.
(For more on reading individual company fundamentals, see: How to Read an Earnings Report)
Real-World Sector Rotation Examples From Recent Market History
2020–2021: The COVID Recovery Rotation
When COVID-19 triggered a sharp recession in early 2020, the textbook defensive sectors held up best during the initial crash — healthcare, consumer staples, and utilities declined far less than the broader market.
Then, as the recovery began in late 2020 and accelerated into 2021, the classic early-cycle rotation played out almost perfectly:
- Consumer Discretionary surged as stimulus checks fueled spending
- Financials rallied as interest rates rose from historical lows
- Energy became the top-performing sector as commodity prices recovered
- Technology peaked early in 2021 and began struggling as inflation and rate hike fears emerged
Investors who recognized this cycle transition and rotated from defensive into cyclical/value sectors in late 2020 were positioned for significant outperformance.
2022: The Inflation Shock Rotation
As inflation surged to 40-year highs and the Federal Reserve began its most aggressive rate-hiking cycle in decades, sector performance diverged dramatically:
- Energy was the only S&P 500 sector to finish 2022 with a positive return (+59%), driven by soaring oil and gas prices
- Utilities and Consumer Staples held up relatively well as defensive safe havens
- Technology fell approximately 33% as rising rates compressed growth valuations
- Consumer Discretionary fell over 37% as inflation squeezed household budgets
- Real Estate dropped significantly as rising rates hit property valuations and REIT financing costs
This was a near-perfect late-cycle playbook — and investors who rotated into energy and defensives ahead of the Fed’s rate hike cycle were dramatically better positioned than those who stayed heavy in technology.
2023–2024: The AI-Driven Technology Resurgence
When the Fed paused rate hikes and the economy proved more resilient than feared, technology came roaring back — led by companies with direct exposure to artificial intelligence infrastructure and software.
The sector rotation story here was nuanced: it wasn’t a classic early-cycle rotation, but rather a thematic rotation within technology as investors differentiated between AI beneficiaries (semiconductors, cloud infrastructure, AI software) and legacy tech names with less direct AI exposure.
Pros and Cons of Sector Rotation Strategy
Pros ✅
- Potentially higher returns than static allocation during clear cycle transitions
- Built-in risk management — rotating into defensives protects capital during downturns
- Systematic framework — reduces emotional decision-making by anchoring decisions to economic data
- Accessible implementation — sector ETFs make this strategy available to all investors
- Complements fundamental analysis — provides top-down context for bottom-up stock selection
Cons ❌
- Cycle timing is imprecise — the economy doesn’t announce which phase it’s entering
- Transaction costs and tax implications — frequent rotation creates taxable events
- Risk of being early or late — sectors can lead or lag their “expected” performance by months
- Requires ongoing research commitment — not a set-it-and-forget-it strategy
- Can underperform a simple index fund over long periods if poorly executed
Common Sector Rotation Mistakes to Avoid
Mistake 1: Rotating After the Move Has Already Happened By the time a sector rotation is obvious in the headlines, much of the performance is already priced in. The most profitable rotations happen when you identify the cycle transition before it becomes consensus.
Mistake 2: Ignoring Valuations Within Sectors Even a sector that’s “supposed to” outperform in a given cycle phase can disappoint if it enters that phase significantly overvalued. Sector rotation works best when combined with basic valuation awareness.
Mistake 3: Over-Rotating (Too Much Concentration) Going 50% or 60% into a single sector based on a cycle thesis introduces significant concentration risk. Most practitioners recommend no more than 20–25% sector overweight versus a benchmark.
Mistake 4: Using Only One Indicator No single economic indicator reliably signals cycle transitions. Successful sector rotation uses a mosaic of signals — yield curve, PMI data, credit spreads, Fed communications, earnings trends, and sector relative strength — rather than any single data point.
Mistake 5: Confusing Sector Rotation With Market Timing Sector rotation is not about predicting whether the market goes up or down — it’s about positioning within the market. The goal is relative outperformance, not absolute market timing.
Key Indicators to Watch for Sector Rotation Signals
These are the data sources and indicators professional sector rotation practitioners monitor most closely:
| Indicator | Source | What It Signals for Rotation |
|---|---|---|
| Yield Curve Shape | U.S. Treasury | Inverted curve signals late cycle / recession risk |
| ISM Manufacturing PMI | Institute for Supply Management | Above 50 = expansion; below 50 = contraction |
| Conference Board LEI | Conference Board | Leading indicator of economic direction |
| Credit Spreads | Federal Reserve / Bloomberg | Widening spreads signal credit stress / late cycle |
| Federal Funds Rate Path | Federal Reserve | Rate hike cycle = late; cut cycle = early recovery |
| Sector Relative Strength | Finviz, StockCharts | Which sectors are already outperforming the index |
| Earnings Revision Trends | Seeking Alpha, Bloomberg | Which sectors seeing analyst estimate upgrades |
Before vs. After: Static Allocation vs. Sector Rotation Approach
| Static Allocation | Sector Rotation | |
|---|---|---|
| Portfolio structure | Fixed weights, rarely rebalanced | Actively tilted toward cycle-favored sectors |
| Research required | Minimal — index fund approach | Moderate — macro monitoring required |
| Tax efficiency | High — minimal transactions | Lower — rotation creates taxable events |
| Downside protection | Market-rate losses in downturns | Defensive rotation can reduce drawdowns |
| Upside capture | Full market participation | Potential outperformance in clear cycle transitions |
| Complexity | Very low | Moderate |
| Best for | Passive, long-term investors | Engaged investors with macro interest |
FAQ: Sector Rotation Strategy Questions Answered
Q1: How often should I rotate between sectors?
Sector rotation is not a monthly or even quarterly mechanical exercise. Economic cycle phases typically last 1–3 years, so significant portfolio rotation might happen only a few times per decade during clear cycle transitions. Making tactical adjustments 1–2 times per year based on evolving economic data is more than sufficient for most investors.
Q2: Can sector rotation work in a retirement account (IRA or 401k)?
Yes — and IRAs are actually ideal for sector rotation because trades don’t trigger immediate tax events. The challenge with 401(k) accounts is that fund selection is limited by your employer’s plan. If your 401(k) offers sector-specific funds or ETFs, you have more flexibility. Many 401(k) plans only offer broad index funds, in which case sector rotation may be better implemented in a separate taxable or IRA account.
Q3: What’s the best resource for tracking sector performance?
Fidelity’s Sector Performance tool is excellent and free. StockCharts.com provides powerful relative strength charts for comparing sector ETFs. FactSet and Bloomberg provide institutional-grade sector data. For a free overview, the SPDR Sector ETFs page on SSGA.com shows current sector performance data.
Q4: Does sector rotation work for international markets too?
Yes, but with added complexity. Different countries and regions are often in different phases of their economic cycles simultaneously. International sector rotation also introduces currency risk and country-specific political/regulatory factors. Many practitioners focus on U.S. sectors first and add international sector tilts (via ETFs like European sector funds) as a more advanced layer.
Q5: How does sector rotation differ from factor investing (value, growth, momentum)?
Sector rotation is a macro-driven, top-down approach — it starts with the economic environment and works down to sectors. Factor investing is typically bottom-up and characteristics-driven — it screens for stocks with specific financial attributes (cheap valuations, earnings momentum, low volatility, etc.) regardless of sector. The two approaches can be complementary — using factor analysis within a sector rotation framework to select the best individual names in favored sectors.
Q6: What happened to sector rotation during the 2020 COVID crash — did it work?
The initial COVID crash was so sudden and severe that all sectors fell together in March 2020 — defensive sectors declined less, but nothing was immune from the liquidity-driven selling panic. However, the recovery phase showed textbook sector rotation behavior: cyclicals led the recovery, energy and financials surged in late 2020 and 2021, while utilities and consumer staples lagged. The rotation framework held up — it just required patience through the initial indiscriminate selling.
Q7: Is there a simple way to know which phase of the economic cycle we’re in?
No single indicator gives you a definitive answer — but the yield curve is one of the most reliable signals. A normal, upward-sloping yield curve (short rates below long rates) suggests mid-cycle expansion. A flat or inverted yield curve (short rates at or above long rates) has historically been one of the most reliable recession predictors. The Federal Reserve Bank of New York maintains a recession probability model based on the yield curve that’s publicly available.
Q8: Can I use sector rotation alongside a core index fund position?
Absolutely — and this is actually the approach many financial advisors recommend. Maintain a large core position in a broad market index fund (which gives you diversified, low-cost exposure to all sectors) and use a smaller tactical allocation to sector ETFs to express your cycle views. This limits your downside if the rotation thesis is wrong while still allowing meaningful benefit if it’s right.
Practical Tools for Sector Rotation Research
- Fidelity Sector Investing Center — Free sector performance data, cycle analysis, and educational resources
- StockCharts Sector Summary — Visual relative strength charts for all 11 sectors
- SPDR Sector ETFs — Official page for all sector ETFs with current holdings and performance
- ISM Manufacturing Report — Monthly PMI data — critical early-cycle indicator
- Conference Board Leading Economic Index — Comprehensive leading indicator composite
📣 Read More
(For site editors:)
- “Understanding Market Volatility: A Beginner’s Guide” (link from the economic cycle and recession phases section)
- “Today’s Stock Movers: What’s Really Driving the Market” (link from the sector performance section)
- “How to Read an Earnings Report” (link from the mid-cycle earnings section)
- “Best Stock Screeners for Retail Investors” (link from the tools section)
Conclusion: The Market Rewards Those Who Understand the Cycle
Here’s the most important thing to take away from everything you’ve just read:
You don’t need to predict the future to use sector rotation effectively. You just need to understand where you are in the present — and position yourself for what historically comes next.
The economic cycle isn’t perfectly predictable. Sectors don’t rotate on a clean, textbook schedule. But the underlying logic is sound, the historical evidence is robust, and the framework gives you something far more valuable than a stock tip or a market prediction — it gives you a way of thinking about the market that professionals have used for decades.
Whether you implement a full tactical sector rotation strategy or simply use this framework to better understand why your portfolio is behaving the way it is — you’re now thinking about markets in a more sophisticated, more contextual, and ultimately more profitable way.
The market always telegraphs its next move. It does it through yield curves, PMI readings, credit spreads, and sector relative strength charts. Most investors never learn to read those signals.
Now you can.
💬 Which economic cycle phase do you think we’re in right now? Drop your view in the comments — it’s a genuinely debated question among professional investors, and we’d love to hear your read on the data.
📩 Subscribe to our weekly sector rotation update — every Monday, we assess current cycle indicators and flag which sectors are showing the strongest relative strength signals heading into the week.
🔗 Share this guide with a fellow investor who’s still picking stocks without a macro framework — it might completely change how they think about portfolio construction.

