

Meta Description: ONGC Q2 FY27 decoded — ₹15,489 cr profit (↑57% YoY), ₹8/share record dividend & what the 9.1% sequential dip really means for investors. Read now.
Introduction: A Tale of Two Numbers
If you opened your trading app this morning and saw ONGC’s Q2 FY27 results flash across your screen, you probably had one of two reactions:
“Wait — profit down 9.1%? Should I be worried?”
Or: “Up 57% year-on-year? That’s fantastic!”
The truth — and the story worth reading carefully — is that both numbers are real, and understanding which one matters more for you is exactly what this article is here to help you figure out.
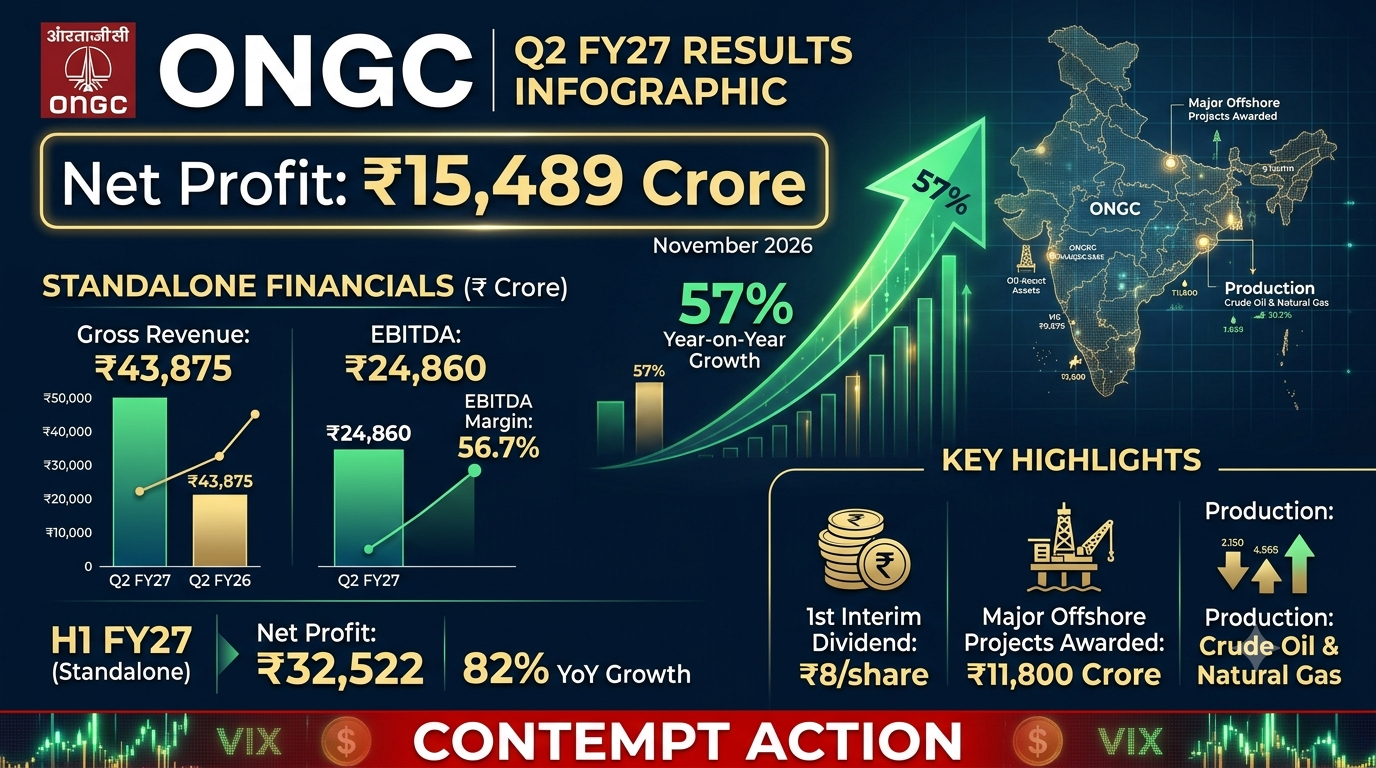
Oil and Natural Gas Corporation Limited (ONGC), India’s leading oil and gas exploration and production company, announced its financial results for Q2 FY 2026-27 on 5 November 2026, revealing a significant surge in profitability and shareholder returns. The company reported a standalone net profit of ₹15,489 crore for Q2, marking a 57.3% increase from the same period last year.
But there’s a second angle: ONGC’s Q2 FY27 revenue fell 5.6% sequentially to ₹43,875 crore, while EBITDA declined 12.3% to ₹24,860 crore — and net profit was down 9.1% from ₹17,034 crore in the previous quarter.
This is, fundamentally, a story about context. Let’s make sure you have all of it.
ONGC Q2 FY27 Results at a Glance
If you need the headlines fast — the kind of snapshot you can share with a colleague or save for quick reference — here they are:
| Metric | Q2 FY27 | Q1 FY27 (Sequential) | Q2 FY26 (YoY) |
|---|---|---|---|
| Standalone Net Profit | ₹15,489 crore | ₹17,034 crore (↓9.1%) | ₹9,848 crore (↑57.3%) |
| Standalone Revenue | ₹43,875 crore | ₹46,460 crore (↓5.6%) | ~₹33,031 crore (↑32.8%) |
| EBITDA | ₹24,860 crore | ~₹28,340 crore (↓12.3%) | — |
| EBITDA Margin | 56.7% | — | — |
| Consolidated Net Profit | ₹18,535 crore | — | ₹12,615 crore (↑46.9%) |
| Consolidated Gross Revenue | ₹1,98,263 crore | — | ~₹1,57,870 crore (↑25.6%) |
| Interim Dividend | ₹8 per share | — | ₹6 per share |
| Record Date | 12 Nov 2026 | — | — |
The direct answer: ONGC posted a sequential dip in profit, revenue, and EBITDA quarter-on-quarter. But on a year-on-year basis, this is one of ONGC’s strongest Q2 performances in years, with profit surging 57.3% and the H1 FY27 cumulative profit hitting a record ₹32,522 crore. The company also declared its highest-ever interim dividend of ₹8 per share.
Why Did Profit Fall 9.1% Sequentially? The Real Story
This is the question most investors are asking, so let’s address it head-on.
Q1 FY27 was an extraordinary quarter — ONGC’s standalone net profit hit ₹17,034 crore, a 112% year-on-year jump, driven by a sharp surge in global crude oil prices and significantly higher gas realisations. That was a tough act to follow.
In Q2 FY27 (July–September 2026), a few factors converged to moderate that momentum:
1. Sequential Crude Oil Price Softening
Global crude oil prices saw some cooling during the July–September 2026 quarter after the sharp run-up in Q1. ONGC’s upstream realisations are directly tied to Brent crude benchmarks, so when prices dip even modestly over a quarter, the financial impact flows through quickly. For comparison, a year ago in Q2 FY26, the fall in profit was primarily driven by a decline in crude oil prices — from $78.33 per barrel in Q2 FY25 to $67.34 in that fiscal — confirming just how directly oil price moves translate into ONGC’s bottom line.
2. EBITDA Compressed Faster Than Revenue
The results show that operating earnings reduced faster than revenue on a quarter-on-quarter basis, resulting in the 9.1% fall in profit. ONGC’s reported quarterly measures were lower than the preceding quarter across revenue, EBITDA, margin and net profit.
This tells us that operating costs didn’t shrink proportionally with revenue — a pattern common in capital-intensive E&P businesses where fixed costs like drilling, depreciation, and statutory levies don’t bend easily quarter to quarter.
3. ONGC Videsh’s International Commitments
ONGC’s international subsidiary has been actively raising capital to fund overseas acquisitions and stake expansions. While these are strategic long-term moves, they add interest outflow pressure in the near term — a topic we’ll cover in depth shortly.
What this means for you: A sequential dip after an extraordinary quarter is not a red flag. It is normal business cyclicality. The year-on-year comparison — structurally the more meaningful metric for most analysts — tells a much more positive story.
The ₹15,489 Crore Profit: What’s Driving the Year-on-Year Surge?
Let’s zoom out. Compared to the same quarter last year, ONGC’s standalone profit surged 57.3% — from ₹9,848 crore to ₹15,489 crore. That is not a small jump. That is the company firing on multiple cylinders simultaneously.
ONGC reported strong financial performance for Q2 FY 2026-27, with consolidated net profit surging 46.9% to ₹18,535 crore against ₹12,615 crore in Q2 FY26. Consolidated gross revenue stood at ₹1,98,263 crore, up 25.6% year-on-year.
Here’s what’s working beneath the headline numbers:
- Higher crude oil and gas realisations compared to Q2 FY26, when low Brent prices had squeezed margins hard
- Improved gas pricing regime — ONGC benefits from the new well gas pricing framework introduced by the Indian government, which has significantly lifted gas realisations for newly drilled wells
- Production stability — for the first half of FY26, production reached 9.314 MMT compared to 9.204 MMT in H1 FY25, and FY27 has maintained this positive trend
- Cost discipline — the company has been actively managing operational expenditure across its onshore and offshore asset base
- H1 FY27 record: The cumulative first-half profit of ₹32,522 crore is a record — a headline that frankly deserves more airtime than the sequential dip
The Dividend Announcement: ₹8 Per Share and Why It’s Historic
If you are a long-term ONGC shareholder or considering becoming one, this section is for you.
ONGC’s Board of Directors has approved the highest ever interim dividend of ₹10,064 crore, equivalent to ₹8 per share or 160%, reflecting the company’s robust financial health and commitment to rewarding its shareholders. The record date for the distribution of this dividend has been set for 12th November 2026.
Why Does This Dividend Matter?
1. It’s genuinely historic. ₹8 per share as an interim dividend — meaning the year isn’t even over yet — sets a new benchmark for ONGC’s dividend generosity. The previous interim dividend, paid in Q2 FY26, was ₹6 per share (120%), with a total payout of ₹7,548 crore. This year’s ₹8 per share represents a 33% increase in dividend per share.
2. Government fiscal arithmetic. Since the Indian government holds approximately 58.9% stake in ONGC, this dividend translates into roughly ₹5,900+ crore flowing directly into government coffers — supporting fiscal management during the second half of the financial year.
3. Confidence signal. Companies announce high dividends when management is confident about near-term cash flows. ONGC’s decision to pay its highest-ever interim dividend signals that the board is not anxious about liquidity despite significant capital expenditure commitments.
Action Point: If you want to be eligible for this ₹8/share dividend, you must hold ONGC shares in your demat account on or before 12 November 2026 (the record date). ONGC had earlier paid a final dividend of ₹1 per share, with an ex-dividend date of 4 September 2026. Combined, that’s already ₹9/share in FY27 — with the possibility of more to come.
EBITDA Deep Dive: What the 56.7% Margin Tells Us
ONGC’s Q2 FY27 EBITDA came in at ₹24,860 crore, with EBITDA declining 12.3% from the previous quarter. With revenue at ₹43,875 crore, that places the EBITDA margin at 56.7%.
To put that in perspective: for every ₹100 of revenue ONGC earns, ₹57 is operating profit before interest, tax, and depreciation. For a capital-heavy upstream oil company with massive infrastructure costs, that is genuinely robust.
EBITDA Comparison Table
| Period | EBITDA | Approximate Margin |
|---|---|---|
| Q2 FY27 | ₹24,860 crore | 56.7% |
| Q1 FY27 | ~₹28,340 crore | ~61.1% |
| Q2 FY26 | Lower | Lower |
The margin compression from Q1 to Q2 reflects the revenue softening with relatively stickier operating costs — exploration expenses, depreciation on producing assets, and employee costs don’t shrink in line with oil price movements. However, the YoY improvement in EBITDA is still substantial, confirming that FY27 is structurally a much better year than FY26 for ONGC’s core operations.
The Consolidated Picture: HPCL Effect and the Full Story
One number that often gets lost in ONGC’s headlines is the consolidated result, which includes subsidiaries like Hindustan Petroleum Corporation Limited (HPCL) and ONGC Videsh.
On a consolidated basis, ONGC posted a net profit of ₹18,535 crore for Q2 FY27, representing a growth of 46.9% against ₹12,615 crore in Q2 FY26.
The consolidated profit being higher than standalone profit signals that subsidiaries contributed positively in Q2 — a contrast to Q1 FY27, where the company reported a 43% decline in consolidated net profit to ₹6,554 crore during Q1 FY27, primarily attributed to the net loss of ₹12,265 crore by HPCL.
This reversal in Q2 consolidated versus Q1 is an important nuance: ONGC’s equity portfolio can swiftly shift the consolidated picture depending on HPCL’s refining margins and OVL’s international outcomes.
ONGC Videsh: The Strategic Wildcard
ONGC Videsh Limited (OVL) — the overseas investment arm — continues to be both ONGC’s growth engine and its most closely watched variable.
OVL has been actively raising international debt to fund its overseas portfolio expansion. Reports indicate OVL has sought a ₹10,000 crore-plus equivalent loan to support its international acquisitions, including its incremental stake in Russian upstream assets. While the near-term interest burden adds to costs, these investments are designed to deliver long-term production and cash flow from diversified geographies across Russia, Brazil, Vietnam, and Mozambique.
What makes OVL strategically significant:
- It provides ONGC exposure to oil price upside outside India’s regulatory pricing environment
- International assets are priced at global benchmarks, insulating ONGC partially from domestic policy changes
- OVL’s production base adds resilience to India’s energy security portfolio
For investors, OVL’s performance remains a swing factor in consolidated results — quarters where OVL does well can significantly lift consolidated profit above standalone numbers, as seen in Q2 FY27.
ONGC’s Strategic Roadmap: The Bigger Picture
Beyond the quarterly numbers, here is what ONGC is building toward — and why the Q2 results need to be read in this longer-term context:
Deepwater Ambition: The ₹1 Lakh Crore Bet
ONGC plans to maintain capital expenditure at more than ₹30,000 crore annually. The company invested over ₹35,000 crore in FY26 and plans to spend more than ₹30,000 crore in FY27.
The company plans capital expenditure of ₹30,000 crore for FY27. This includes a ₹1 lakh crore deepwater exploration push under its “Samudra Manthan” initiative, targeting 87 new wells by FY31. If even a portion of these wells strike commercially viable reserves, the production upside would be transformational.
New Well Gas Pricing: A Structural Tailwind
The government’s revised gas pricing framework continues to benefit ONGC. New well gas now commands premium prices, and as more new wells come onstream, this revenue stream becomes increasingly significant — adding a layer of earnings resilience that didn’t exist three years ago.
Pros and Cons: Should You Be Bullish on ONGC?
This is not investment advice — always consult your SEBI-registered financial advisor. But here’s an honest framework:
✅ Reasons for Optimism
- Highest-ever H1 profit of ₹32,522 crore — fundamentals are genuinely strong
- Record interim dividend of ₹8/share — excellent for income-focused investors
- Deepwater exploration pipeline offers significant long-term production upside
- Improved gas realisations adding a structurally new revenue dimension
- Strong YoY growth trajectory (57% profit growth) well ahead of analyst estimates
- Impressive performance driven by a 32.8% rise in standalone gross revenue to ₹43,875 crore
⚠️ Watch-outs
- Crude oil prices remain volatile — ONGC’s earnings are highly sensitive to Brent benchmarks
- ONGC Videsh’s geopolitical exposure (Russia, Mozambique) carries execution and sanctions risk
- HPCL continues to be a drag on consolidated results in certain quarters (as it was in Q1)
- Subsidy burden could return if the government asks oil PSUs to absorb price increases at the pump
- The 9.1% sequential profit dip signals Q1’s exceptional performance may not immediately repeat
Before and After: ONGC’s FY27 Journey in Numbers
| Metric | Q2 FY26 (A Year Ago) | Q1 FY27 (Last Quarter) | Q2 FY27 (Now) |
|---|---|---|---|
| Net Profit | ₹9,848 cr | ₹17,034 cr | ₹15,489 cr |
| Revenue | ~₹33,031 cr | ₹46,460 cr | ₹43,875 cr |
| Interim Dividend | ₹6/share | — | ₹8/share |
| Investor Sentiment | Cautious (oil prices low) | Euphoric (112% jump) | Measured optimism |
The narrative here is one of a company that had a genuinely difficult FY26 — lower oil prices, compressed margins, a struggling HPCL subsidiary — and has now roared back in FY27 with a record first half. The sequential dip is a normalisation, not a deterioration.
What Should You Actually Do? Practical Guidance
If you already hold ONGC:
Verify that you are on track to hold shares before the 12 November 2026 record date to capture the ₹8/share dividend. Beyond that, your holding thesis rests on crude oil prices and whether the deepwater programme starts delivering production results in FY28-29.
If you are evaluating ONGC as a new investment:
The stock’s attractiveness hinges significantly on your personal view of Brent crude over the next 6–18 months. If you believe oil sustains above $70/barrel, ONGC’s earnings trajectory looks well-supported. The deepwater exploration programme is optionality on top of that.
If you are a dividend-focused investor:
ONGC’s FY27 dividend track record is compelling. Total FY27 dividends already declared: ₹9/share (₹1 final + ₹8 interim). With the full year results still to come, there is potential for more.
Follow the analyst call: ONGC will hold its Q2 FY27 analyst and investor call at 3:30 PM IST on 6 November 2026. Management commentary on crude oil price assumptions, production guidance, and OVL updates will provide critical clarity for investors.
Authoritative reference: For verified ONGC quarterly filings, always check the BSE India official disclosures page and ONGC’s official investor relations portal.
Frequently Asked Questions (FAQ)
1. What was ONGC’s net profit in Q2 FY27 (Q2 Results 2026)?
ONGC reported a standalone net profit of ₹15,489 crore for Q2 FY27, marking a 57.3% increase from the same period last year. On a consolidated basis, net profit stood at ₹18,535 crore, up 46.9% year-on-year.
2. Why did ONGC’s profit fall 9.1% — is it concerning?
The 9.1% decline is sequential only — compared to the previous quarter (Q1 FY27), not to the same quarter last year. ONGC’s Q1 FY27 standalone net profit was ₹17,034 crore, a 112% year-on-year jump — an exceptionally high base. The dip to ₹15,489 crore in Q2 is a normalisation, not a deterioration. Year-on-year, profit actually rose 57.3%.
3. What is the ONGC Q2 FY27 interim dividend and record date?
ONGC declared an interim dividend of ₹8 per share (160% of face value), amounting to a total outgo of ₹10,064 crore. The record date has been set for 12th November 2026. This is the highest-ever interim dividend in ONGC’s history.
4. What is ONGC’s EBITDA and EBITDA margin for Q2 FY27?
ONGC’s EBITDA for Q2 FY27 came in at ₹24,860 crore, declining 12.3% from the previous quarter. With revenue at ₹43,875 crore, this places the EBITDA margin at 56.7% — a robust figure for an upstream oil and gas company.
5. What is ONGC Videsh’s role in the Q2 results?
ONGC Videsh (OVL) is ONGC’s international subsidiary that invests in overseas oil and gas assets. OVL has been actively raising significant loans — reportedly a ₹10,000 crore equivalent facility — for international acquisitions. In Q2 FY27, OVL’s contributions helped push consolidated profit (₹18,535 crore) meaningfully above standalone profit (₹15,489 crore), a positive reversal from Q1 when HPCL’s losses had dragged consolidated results down.
6. What was ONGC’s revenue in Q2 FY27?
ONGC’s standalone gross revenue for Q2 FY27 was ₹43,875 crore, driven by a 32.8% year-on-year rise. Sequentially, revenue was down 5.6% from ₹46,460 crore in Q1 FY27.
7. How does Q2 FY27 compare to Q2 FY26?
The comparison is strongly positive. In Q2 FY26, ONGC’s gross revenue fell 2.5% to ₹33,031 crore and net profit stood at ₹9,848 crore, impacted by lower crude oil prices — Brent was at $67.34/barrel. Q2 FY27’s ₹15,489 crore profit and ₹43,875 crore revenue represent massive year-on-year improvements.
8. When will ONGC announce further results or dividends?
ONGC’s Q3 FY27 results are expected around February 2027. Any second interim dividend would typically be declared alongside Q3 results. The Q2 FY27 analyst and investor call is scheduled at 3:30 PM IST on 6 November 2026 — worth attending for forward guidance.
Conclusion: Keep the ONGC Story in Perspective
Here’s the takeaway that matters most:
ONGC’s Q2 FY27 results are a story of financial strength, not weakness.
The sequential dip in profit — the ₹1,545 crore drop from Q1’s exceptional performance — was always likely after one of ONGC’s best-ever standalone quarters. What’s genuinely impressive is that even in this “weaker” quarter, ONGC posted its highest-ever H1 profit, declared its highest-ever interim dividend, and grew profit a resounding 57% year-on-year.
ONGC’s Q2 FY27 update combines a 9.1% sequential fall in net profit to ₹15,489 crore with a 5.6% reduction in revenue and a lower EBITDA margin — but these are numbers relative to an extraordinary Q1. The year-on-year story is one of meaningful recovery and strength.
If you are evaluating ONGC as an investment or trying to understand what these results mean for your portfolio, the framework is straightforward: watch crude oil prices (the single biggest swing factor), track ONGC Videsh’s progress on international assets, and keep an eye on whether the deepwater exploration programme begins delivering commercial results.
India’s energy security story runs directly through ONGC. The company is operating from a position of real financial strength heading into the second half of FY27.
Found this analysis useful? Share it with fellow investors, subscribe to our newsletter for quarterly earnings deep-dives, and drop your questions in the comments below — we read and respond to every one.

