
What is the current level of the VIX today? As of May 17, 2026, the VIX closed Friday at 18.43. Discover how this fear index impacts your portfolio, upcoming catalysts, and why traders are watching closely for volatility spikes.
Just now, on this quiet Sunday morning of May 17, 2026, investors worldwide are checking their screens with a mix of relief and caution. The CBOE Volatility Index, better known as the VIX, settled at 18.43 after Friday’s trading session.
While not in panic territory, this level sits modestly above the long-term average, signaling lingering unease beneath the surface of a resilient stock market. For millions of everyday investors and seasoned traders alike, understanding the current VIX level feels more important than ever amid geopolitical tensions, inflation concerns, and major economic reports on the horizon.
Here’s a clear, timely breakdown of what the VIX means for you right now and what to watch next.
What Is the Current Level of the VIX? A Snapshot of Market Fear
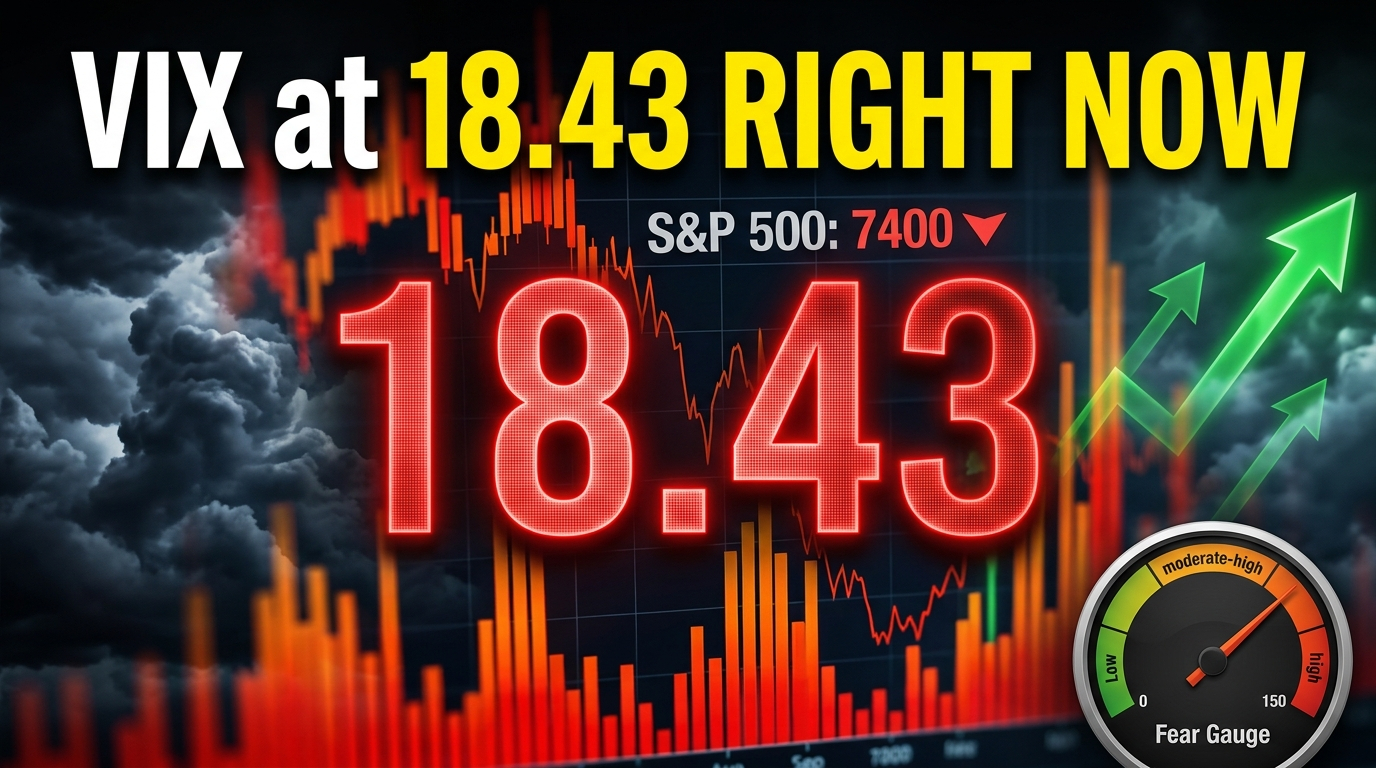
The VIX closed at 18.43 on Friday, May 15, 2026, up about 6.78% that day but still reflecting relatively contained fear compared to turbulent periods earlier this year.
Often called Wall Street’s “fear gauge,” the VIX measures expected volatility in the S&P 500 over the next 30 days, derived from options prices. A reading around 18 suggests investors are pricing in moderate swings rather than all-out turmoil.
For context, levels below 15 typically signal complacency, while anything above 30 screams high anxiety. At 18.43, the market is in a watchful “yellow zone”—nervous but not yet alarmed. This comes after a strong recovery in equities, where the S&P 500 has been testing record territory near 7,400–7,500.
How Does the VIX Impact S&P 500 Options Prices?
When the VIX rises, fear drives up demand for protective options on the S&P 500. This directly inflates premiums, making it more expensive to hedge portfolios or speculate on big moves.
Conversely, a lower or stable VIX like today’s 18.43 keeps options more affordable, encouraging bullish strategies and supporting higher stock valuations. Many traders use the VIX as a timing tool: falling volatility often coincides with steady market climbs, while sudden spikes can trigger sharp sell-offs as investors rush for safety.
In simple terms, a higher VIX acts like rising insurance costs—it protects you but eats into potential returns. Right now, the moderate level supports the ongoing bull run but leaves little room for error if unexpected shocks hit.
What Was the Highest Level the VIX Reached in 2026?
The VIX experienced real drama earlier in 2026. It surged above 30 multiple times, with reports of intraday peaks near 35.3 in March amid tariff tensions and global uncertainty.
That spike reflected genuine investor panic over trade policies, energy prices, and inflation. The fear gauge later cooled significantly, dropping back toward the mid-teens before stabilizing in the high teens recently.
This pattern reminds us how quickly sentiment can shift. The 2026 high so far highlights how external events can override strong fundamentals, creating both danger and opportunity for volatility traders.
Which Economic Reports Are Expected to Impact Volatility Next Week?
Traders are bracing for several key data releases in the coming days that could jolt the VIX. Upcoming inflation readings, retail sales figures, and housing data top the list.
Any surprises—especially hotter-than-expected inflation—could push the fear index higher and pressure equities. Earnings from major companies will also play a role, as whispers of mixed results in certain sectors add another layer of uncertainty.
With the market already near highs, these reports carry extra weight. A benign set of numbers could keep the VIX subdued and fuel further gains, while disappointments might spark a swift repricing of risk.
How Did the Nasdaq and Dow Perform Compared to the S&P 500?
In recent sessions, the tech-heavy Nasdaq has continued to outperform, driven by AI enthusiasm and strong performances from mega-cap names. It has posted solid weekly gains, often outpacing the broader S&P 500.
The Dow Jones Industrial Average, more value-oriented and industrial-focused, has shown steadier but less explosive moves. While the S&P 500 has hit multiple record closes near 7,400–7,501, the Dow has lagged slightly in percentage terms, reflecting rotation dynamics where growth stocks dominate.
This divergence highlights a classic market theme: innovation and technology powering the indexes higher, even as traditional sectors play catch-up.
Which S&P 500 Companies Have the Highest Market Cap Right Now?
As of mid-May 2026, the leaderboard remains dominated by technology giants riding the AI wave:
- Nvidia leads with a market cap exceeding $5.2 trillion.
- Alphabet (Google) follows closely around $4.8 trillion.
- Apple sits comfortably in the top tier near $4.3 trillion.
- Microsoft and others round out the elite group.
These companies not only drive index performance but also influence volatility. Their earnings, product announcements, and regulatory headlines can move the entire market—and by extension, the VIX—in meaningful ways.
Key Stats and Takeaways on the Current VIX Environment
- Current VIX Level: 18.43 (Friday close, May 15, 2026) — moderate fear with room to run on both sides.
- 2026 Peak: Approached or exceeded 35 intraday in March amid tariff and inflation worries.
- Long-term Average: Around 18–20; today’s reading is near neutral territory.
- Next Major Catalyst: Fed meeting scheduled for June 16–17, 2026, where rate signals could dramatically shift volatility expectations.
- Top S&P 500 Heavyweights: Nvidia, Alphabet, Apple, and Microsoft command outsized influence on index direction and options pricing.
- Market Performance: Nasdaq leading gains on tech strength, while S&P 500 sets records and Dow trails modestly.
These figures paint a picture of resilience with underlying tension—perfect conditions for alert, prepared investors.
As we head into the new week, the VIX at 18.43 serves as a gentle reminder: markets can climb walls of worry, but staying informed is your best defense. Whether you’re a long-term investor protecting retirement savings or an active trader scanning for opportunities, understanding today’s volatility landscape helps you navigate with confidence and clarity.
The story isn’t over—next week’s data and the upcoming Fed meetings could rewrite the script quickly. Stay watchful, stay diversified, and remember that measured risk often rewards patience.
Read More
US Indexes Retreat from Record Highs Amid Volatility- What It Means for Your Money Right Now
About the Author
Michael Hargrove is a seasoned financial journalist with 15 years of experience covering global markets, volatility trends, and macroeconomic shifts. Based in New York, he specializes in making complex topics like the VIX and options trading accessible to everyday investors. When not analyzing market data, Michael enjoys mentoring young analysts and exploring emerging investment themes. Follow his insights for timely, unbiased market updates.
